




Statistical Quality Control

Statistical Quality Control介绍
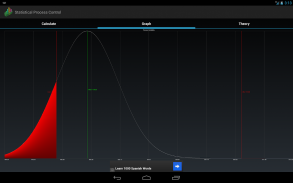
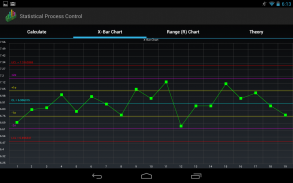
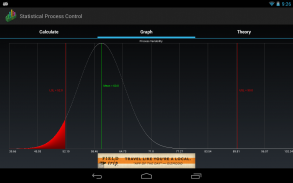
Statistical Process Control is a statistical tool of Statistical Quality Control, used by the quality professional. Control Charts aid the Six Sigma professional in the process of determining if a process is under control.
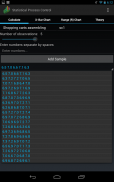
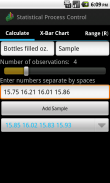
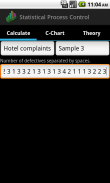
All you need to do is to enter numbers separated by spaces and see the results immediately.
List of features:
- X-Bar Chart
- Range (R) Chart
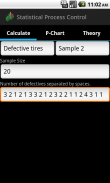
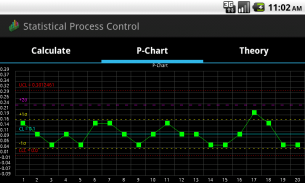
- P-Chart
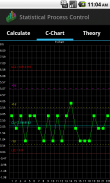
- C-Chart
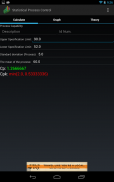
- Process Capability, Cp, Cpk
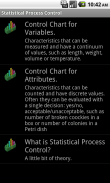
- Theory and examples.
Statistical Process Control is applied in order to monitor and control a process. SPC can be applied to any process where the "conforming product" (product meeting specifications) output can be measured. Applied to Production processes as well as services, Hotels, Restaurants, Banks...
You could study the examples and try to design a method to monitor your production process or service.
Your last data are persistent. You can close and reopen your app and to continue adding data. data will be deleted when you start a new data set.
Your comments will be appreciated and I have the commitment of improve the application with more features.
</div> <div class="id-app-translated-desc" style="display:none">统计过程控制是一个统计工具,统计质量控制,由高素质的专业使用。控制图帮助六西格玛专业的过程中确定,如果一个进程控制之下。
所有你需要做的是进入由空格分隔的数字,并立即看到结果。
功能列表:
- X-条形图
- 极差(R)图
- P图
- C-图
- 制程能力,CP,CPK
- 理论与实例。
统计过程控制应用,以监测和控制过程。 SPC可以应用到任何过程中的“不合格品”(产品会议规格)输出可将测量。应用到生产流程以及服务,酒店,餐厅,银行...
你可以学习的例子,并尝试设计一种方法来监控您的生产过程或服务。
你的最后一个数据是持久的。您可以关闭并重新打开你的应用程序,并继续添加数据。当你开始一个新的数据集,数据将被删除。
您的意见将不胜感激,我有决心提高应用程序有更多的功能。</div> <div class="show-more-end">


